Data Collection
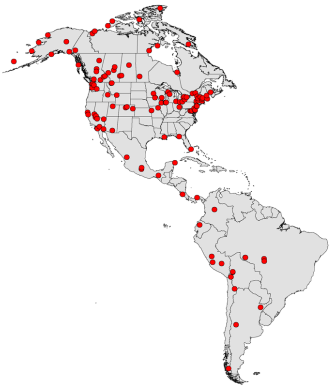 Figure1: Location of articles in North and South America
Media reports were sourced using news.google.ca with search terms "climate change", "global warming" and "greenhouse gas". Articles needed to be published within the last 5 years and relate to a climate issue in North or South America. "Pins", seen here in red, were created for each article based on the location in the media report using maps.google.ca.
Each media report has at least one corresponding scientific article to support the climate change occurrence documented. Scientific articles were found by scanning the references of various IPCC reports, climate change maps (i.e. Climate Hot Map), and search engines (i.e. Web of Science, Google Scholar, etc.). Research from the scientific articles needed to be conducted in North or South America and could not be based on projections (all reports needed to have real data collected and therefore represent climate change that is currently occurring and not projected to occur in the future).
Each media report has at least one corresponding scientific article to support the climate change occurrence documented. Scientific articles were found by scanning the references of various IPCC reports, climate change maps (i.e. Climate Hot Map), and search engines (i.e. Web of Science, Google Scholar, etc.). Research from the scientific articles needed to be conducted in North or South America and could not be based on projections (all reports needed to have real data collected and therefore represent climate change that is currently occurring and not projected to occur in the future).
North American Media Accounts
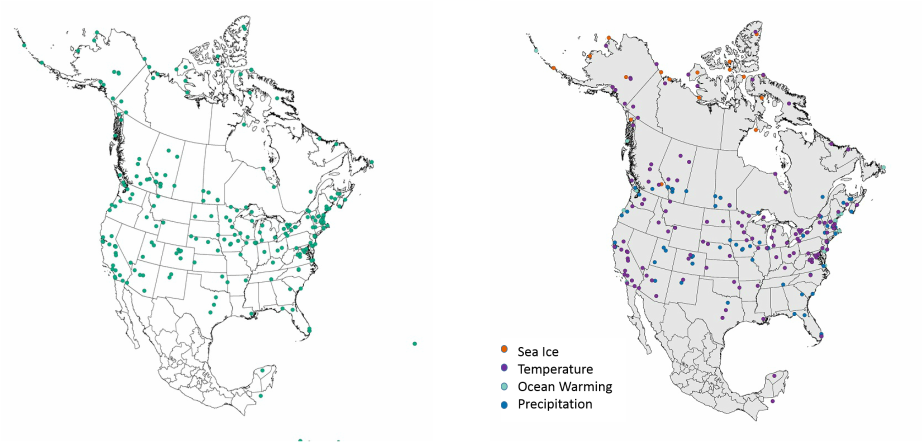 Figure 2: Locations of North American online print media articles;
Figure 3: Locations of North American online print media articles coloured by story theme
Figure 2: Locations of North American online print media articles;
Figure 3: Locations of North American online print media articles coloured by story theme
Based on the content of the reports, articles were grouped into four major themes: temperature, precipitation, sea ice melt and ocean warming (Figure 3). This data has been contriuted to the soon-to-be published Climascopio.org webpage sponsored by Fulbright (Figure 4). On this site, users are able to choose from one of the major four themes (separated by tabs on the website) where all the correlating stories will be represented by a "pin". By selecting a "pin", the article and corresponding scientific climate change data is displayed in an effort to support or reject the validity of the account. This user-friendly interface provides easily accessibe information that helps frame the article in a more apporpriate manner allowing individuals to gain a big-picture understanding of the issue at hand alleviating the consequences of journalistic framing.
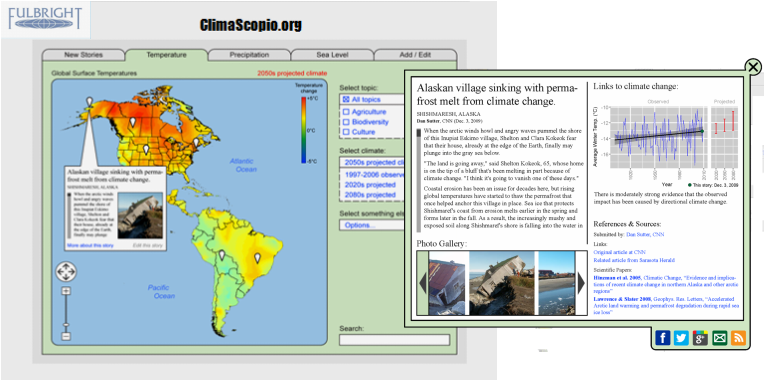
Figure 4: Climascopio.org layout sponspored by Fulbright
Climate Data
ClimateWNA v.4.62 (Wang et al, 2012) program was utilized to generate climate data for every article in North America. This program uses the latitude, longitude and elevation data for every point to calculate seasonal and annual climate variables from 1901-2012. Of most relevance were the following twelve climate variables:
Two articles have been chosen to best illustrate the subsequent statistical analyses.
- Mean Annual Temperature (°C) - MAT
- Mean Annual Precipitation (mm) - MAP
- Winter (December of previous year - February) Mean Temperature (°C)
- Spring (March - May) Mean Temperature (°C)
- Summer (June - August) Mean Temperature (°C)
- Autumn (Septermber - November) Mean Temperature (°C)
- Winter Precipitation (mm)
- Spring Precipitation (mm)
- Summer Precipitation (mm)
- Autumn Precipitation (mm)
- Number of Frost-Free Days -NFFD
- Frost-Free Period -FFP
- Annual Heat Moisture Index (MAT+10)/(MAP/1000))
Two articles have been chosen to best illustrate the subsequent statistical analyses.
Statistical Analysis
Article 1: Climate Change Causing US Wildfire Season to Last Longer
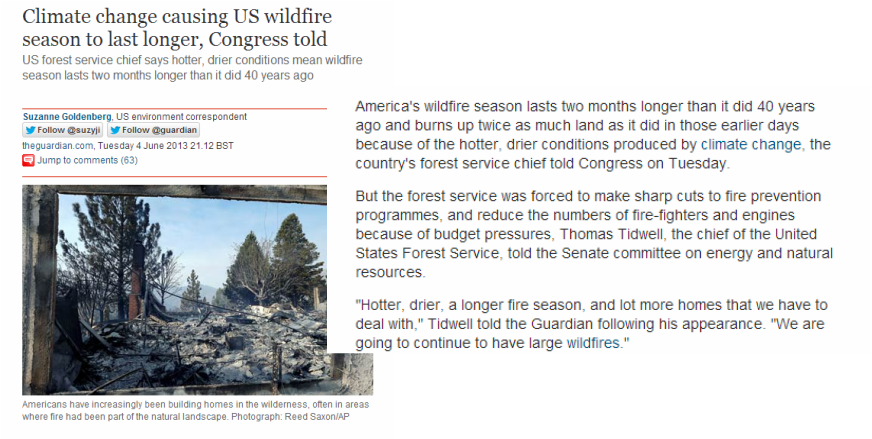 Figure 5: Article referencing increased temperature and drought resulting in a longer and more hazardous fire season in California including three quotes from the article.
In this first article, shown in Figure 5, the two key climatic variables referenced are those related to an increase in temperature and drought. To determine if the this area has experienced an increase in both, a graph can be made analyzing Mean Annual Temperature (MAT) as well as Annual Heat: Moisture Index (AH:M). This will be graphed over one hundred and eleven years and a regression of the data will be performed to determine relationship.
Article 2: Alaska Sinks as Climate Change Thaws Permafrost
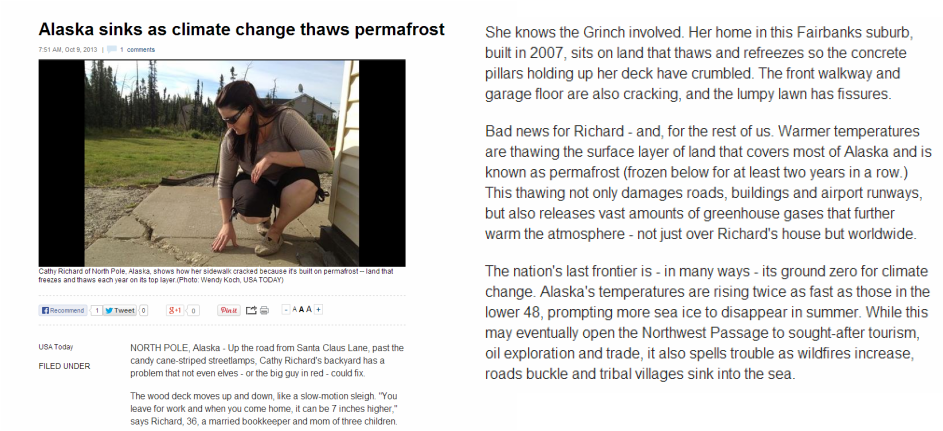 Figure 6: Article referencing increased temperature in Alaska as the culprit behind permafrost melt including relevant quotes.
In this second article, shown in Figure 6, the climatic variables referenced are those related to an increase in temperature and decrease in frost period. To determine if this area in Alaska is experiencing these effects, graphs can be constructed that analyze Mean Annual Temperature (MAT), Number of Frost Free Days (NFFD) and Frost Free Period (FFP). By graphing these variables over the one hundred and eleven year period of data generated by ClimateWNA (Wang et al. 2011), a regression of the data will be performed to determine relationship and verify or reject the validity of the article.
