Data Tables
Below are a few sample rows of data to display how the data was organized as well as some of the variables that were analyzed. The sampling units are the locations of each "pin" in North and South America. In this study we are measuring climate variables at fixed locations over a fixed number of years. Therefore, the dependent variables, also known as the response variables, are the climate variables (the data generated by ClimateWNA). The independent variables, also known as the predictor variables, are the locations and the time period (continuous data) as well as the media reports and scientific articles (categorical data).
When querying news.google.ca for articles based on criteria stated in the Methods section, a unique identification number was created for each report including the first three letters of the country of origin. Additionally, a tinyURL was generated for each article and the latitude and longitude were determined for the location mentioned in each individual article using maps.google.ca. Table 1 offers an abbreviated portion of this information.
It was important to separate each article based on the major climatic variable being reported: temperature, sea ice melt, ocean warming and precipitation. Table 2 offers an abbreviated portion of this information.
Table 3 and Table 4 provide an abbreviated portion of information regarding analysis with the ClimateWNA (Wang et al, 2011) program. Elevation, latitude and longitude were used by the program to generate annual and seasonal climatic variables, four of which are displayed in Table 4 for CAN 10. This was carried out for every article and multiple climatic variables from 1901 until 2012.
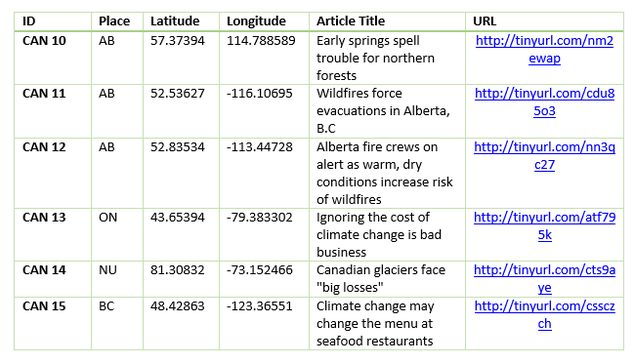
Table 1: Abbreviated portion of data displaying the unique ID, location of story, title of story and corresponding link
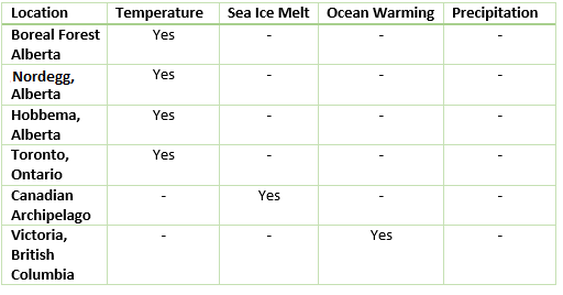
Table 2: Abbreviated portion of data showing categorized theme and location of each of the articles for the IDs in Table1
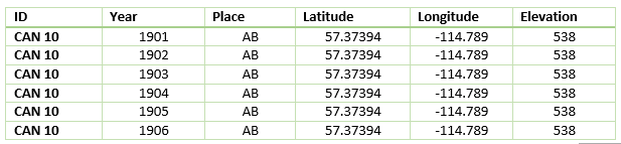
Table 3: Abbreviated portion of data after analysis for ID CAN 10 in ClimateWNA. Data for various annual and seasonal climatic variables has been generated annually starting in 1901.
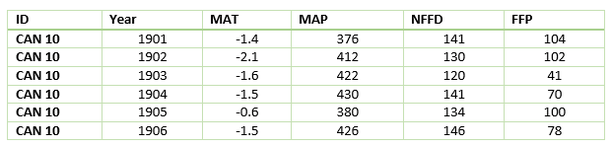
Table 4: Abbreviated portion of data after analysis for ID CAN 10 in ClimateWNA displaying 4 annual climate variables of interest.
MAT - Mean Annual Temperature (°C),
MAP - Mean Annual Precipitation (mm),
NFFD - Number of Frost Free Days,
FFP - Frost Free Period.
